Lightning Network Cohort Analysis: Data
- How many new nodes sign up each month?
- How many we loose per month
- How do nodes behave when they sign-up, How long they are alive before they are dead. Do they come alive from dead? Do they resurrect?
These questions come to mind when we start thinking about growth of Lightning network.
The goal of this post is to share data, provide some interpretation, and get answers to the above basic questions. In the next iteration of cohort analysis, I’ll pass more coherent and holistic story.
The Data & the Methodology
Data: We have LN graph output from an LND node since May-2023. We are analysing graph data pulled on a day of the first week for following months. Here is how the data looks.
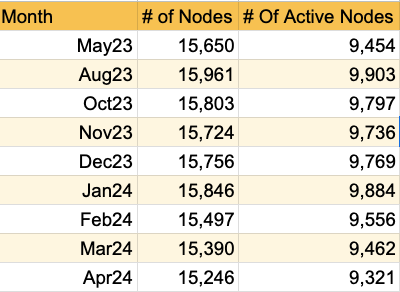
#of Nodes is count of unique pub key from the graph output. Active nodes: Nodes with at least one active public channel that has sent at least one update to its peer.
What you need to make a note, looking at the table above:
- There is no data for June, July and September. It just tells you I was not looking to store historical data for analysis at that time. Nonetheless, for our puspose, 9 months of data is enough
- We’ll focus our analysis on only active nodes.
Methodology:
- We’ll look at all active nodes in a month, and continue monitoring how many of them are active in subsequent months
- We’ll also monitor how many ‘new and resurrected’ node we see in a month, and we’ll also follow their behavior in analysis window.
- New and resurrected nodes for a month are nodes we are seeing for the first time in the observation window ( October-23 to April-24) . For December cohort, the # of new and resurrected nodes are nodes that we saw first time in Decembe, that is we didnt see them in October or November.
- We are calling these set of users ‘new and resurrected’, not just new because we have resurrected node in the cohort as well. For example, a node that was active in August, but not active in October, november and start showing up in December is getting counted in December Cohort. What % of these nodes are resurrected? Based on additional data I estimate that up to 40% of those nodes could be resurrected.
Heat Map
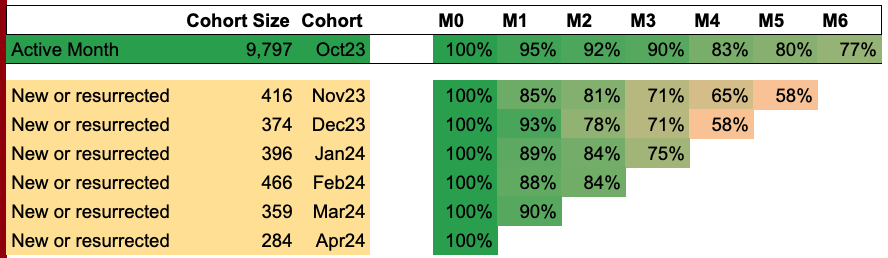
What to read from the heatmap above:
- Row 1, out of ~10K nodes active in october, 90% would stay active for next 3 months, but after 6 months, only 75% would stay active. I have seen from additional months of data that the trend holds.
- From row 2-7, ~60% of new and resurrected nodes stay active after 4-5 months.
- I’m pleased if you are wondering why the # for ‘new and resurrected node’ is trending down, from 416 in Nov-23 to 284 in Apr24. A newer version of the heatmap above will make it easier to understand.
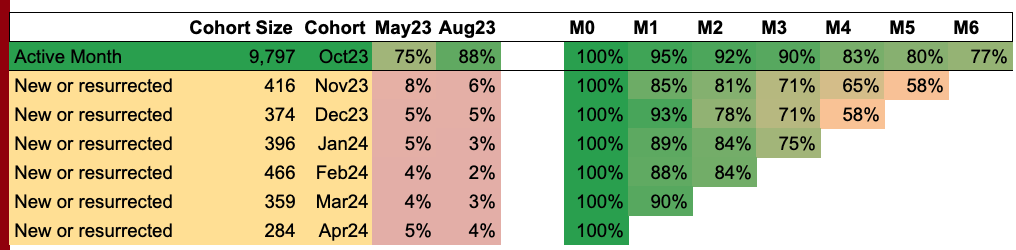
- Now, we can notice that 8% and 6% of Nov23 Cohort nodes (416) were active in May23 and Aug23 respectively. The way we have defined out cohort, we know that none of them was active in October. Anyway, these 8% and 6% are resurrected nodes.
- As we go down the newer cohorts, we also see that only 2-4% of these nodes were active in May23 and Aug23. We wont be wrong to assume that our analysis methodology makes sure that only small fraction of nodes are resurrected nodes in newer cohorts.
The answers we were seeking
- Q: How many new nodes sign up each month? ~300 per month
- Q: How many we loose per month? Going with the definition of’ not active’ in the next month as loosing, the number is ~500 per month
- Q: A follow up, If we gain ~300, and loose ~500 per month, how come all LN explores have been showing ~15k nodes for almost a year. Should not the # of nodes go down? The answer is a lot of them come back, we can say evetually 200 of them or 40% of them come back.
- Q: How do nodes behave when they sign-up, How long they are alive before they are dead. Do they come alive from dead? Read through the points we discussed on the heatmap section.
Notes and Next step
- Even though there is some insight into the analysis, we should not read a lot here. In general, LN is an early technology, a majority of nodes are LN enthusiast playing around, and the big nodes are bitcoin business who are here to support the technology and reap the benefit of being an early adopter.
- Defining cohort based on obervation window has its own challenge, so in the next iteration, we’ll look to define it based on first channel open transaction for the node. If we only look at currently active channel, we may miss early behaviors, so we will include/exclude closed channel open transaction in our analysis based on data.
- Here is a Google Sheet with cohort analysis data